Creating Raincloud plots in R2
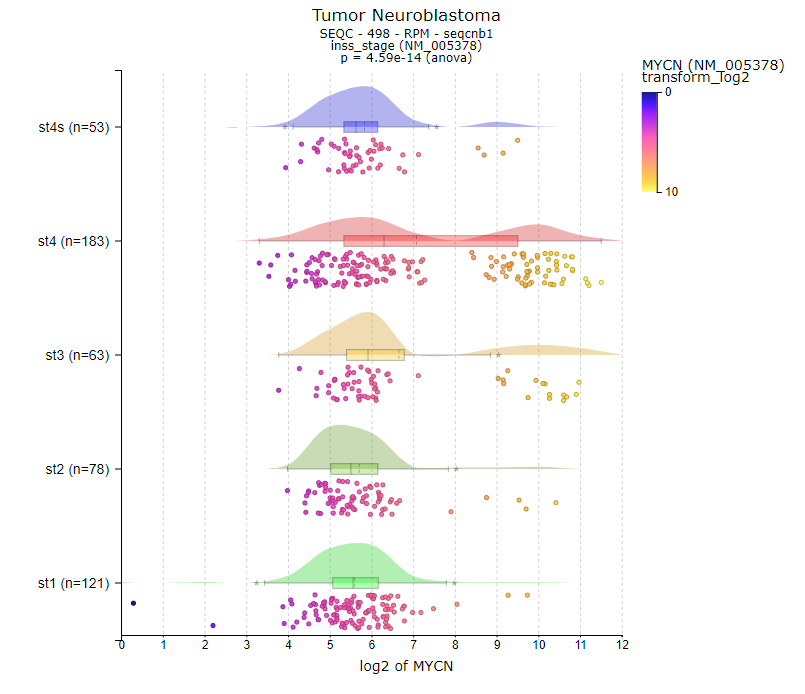
Imagine you're studying the levels of a particular gene's expression in different samples. Each cell type has its own level of gene expression, and you've collected this data for many samples. Now, you want to visualize this data in a single comprehensive overview. Let's do this using a raincloud plot.
Dots or Raindrops: On the raincloud plot, you'll have a bunch of small dots, like raindrops, scattered along a horizontal axis. Each dot represents the gene expression level in a single sample. Samples with higher expression levels will have dots higher on the axis, and samples with lower expression levels will have dots lower on the axis.
Cloud-like Shapes: The raindrops will be surrounded by cloud-like shapes. These shapes show you the distribution of the gene expression levels. If the cloud is wide and covers a large area along the axis, it means the gene expression levels are spread out across a wide range of values. If the cloud is narrow and tall, it indicates that most samples have similar expression levels.
Histogram or Density Plot: Inside the cloud, there will be a colored or shaded area that resembles a histogram turned on its side. This area represents the frequency of different expression levels. Higher peaks in the area mean that certain expression levels are more common among the samples.
By looking at the raincloud plot of mRNA gene expression data, you can quickly grasp important information: you can see where most cells' expression levels lie, how much variation exists in the data, and which levels are more prevalent. This type of visualization helps researchers identify potential trends or outliers in the gene expression data, aiding in their analysis and interpretation of the biological processes at play.
Within the R2platform (https://r2.amc.nl), the raincloud plot is one of the standard plots when inspecting 'view a gene in groups'.


Comments
Post a Comment